While developing with Windows Azure SDK and local Azure development fabric, when things go wrong, they go really wrong.
It could something as obscure as leaving an empty element somewhere in Web.config or a certificate issue.
The problem is, that before Visual Studio attaches a debugger into a IIS worker process, a lot of things can go wrong. What you get, it this:
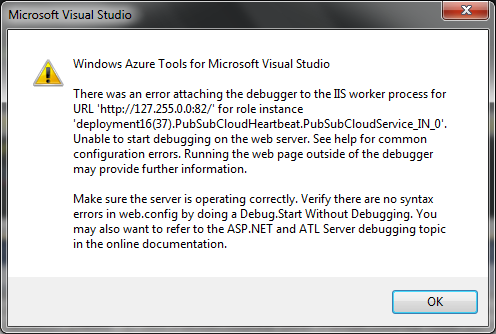
There's no Event Log entry, nothing in a typical dev fabric temp folder (always, check 'C:\Users\\AppData\Local\Temp\Visual Studio Web Debugger.log' first), nada.
Poking deeper, what you need to do is allow IIS to respond properly. By default IIS only displays complete error details for local addresses. So, to get a detailed report you need to use a local address.
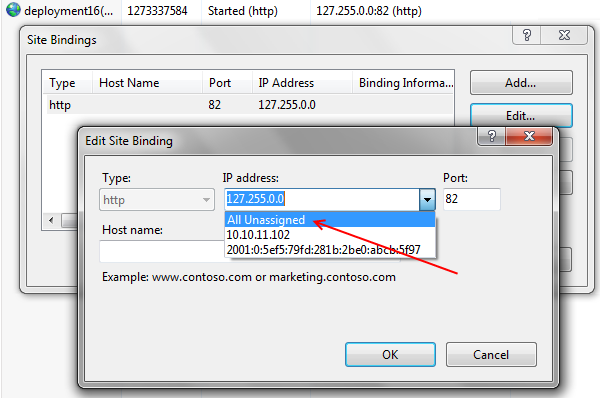
You can get a local address by fiddling with the site binding with IIS Manager and changing what Azure SDK does, so:
- First, start IIS Management Console.
- Then right click on your deployment(*).* and select Edit Bindings.
- Select All Unassigned
If you hit your web / service role using the new local address (could be something like http://127.0.0.1:82), you are most likely getting the full disclosure, like this:
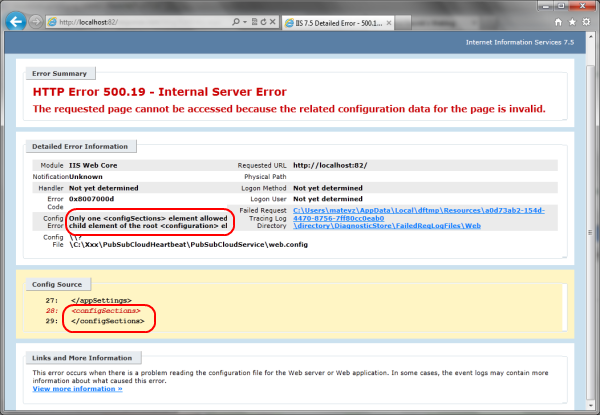
In this case, a service was dispatched into dev fabric, which had an empty element somewhere in Web.config. The web role was failing before Visual Studio could attach a debugger, and only HTTP 500 was returned through normal means of communication.